Fig. 1
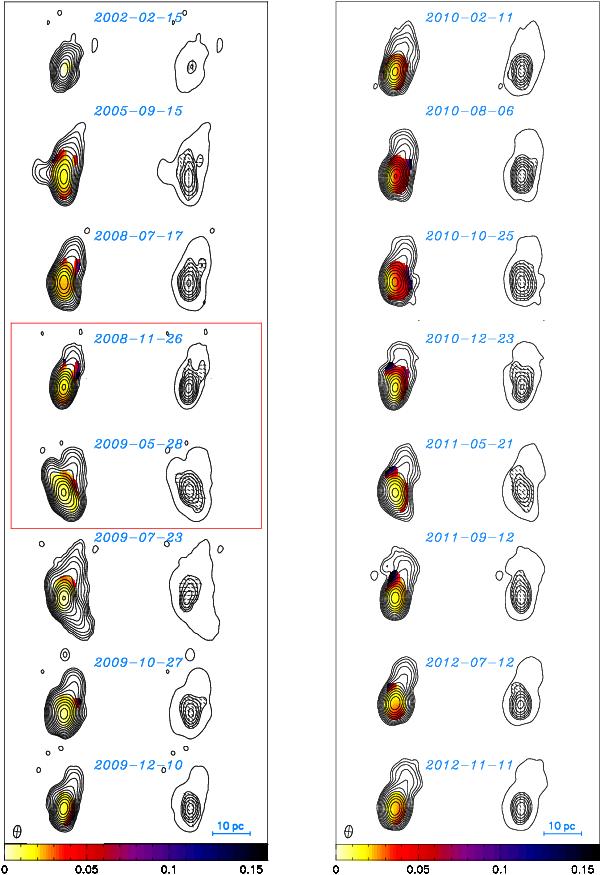
Sequence of 15.4 GHz VLBA images showing structural changes in the quasar 2023+335
during a 10.8 yr period. The first two images are non-MOJAVE image from the VLBA
archive. The most dramatic parsec-scale variations occurred between 2008.9 and 2009.4
marked by a red box. For each epoch we present two images. The first image is a
naturally weighted total intensity map with linear fractional polarization overlaid
according to the color wedge. The second image includes the lowest positive total
intensity contour from the first image, and linearly polarized intensity contours
together with electric polarization vector directions. The crossed ellipse in the
lower left represents the FWHM of the restoring beam of 0.96 × 0.56 mas at
 , which is the median
for all restoring beams at the 16 epochs. One milliarcsecond corresponds to about 3.5
pc at the source redshift of z = 0.22. The image parameters are
listed in Table 1.
, which is the median
for all restoring beams at the 16 epochs. One milliarcsecond corresponds to about 3.5
pc at the source redshift of z = 0.22. The image parameters are
listed in Table 1.
Current usage metrics show cumulative count of Article Views (full-text article views including HTML views, PDF and ePub downloads, according to the available data) and Abstracts Views on Vision4Press platform.
Data correspond to usage on the plateform after 2015. The current usage metrics is available 48-96 hours after online publication and is updated daily on week days.
Initial download of the metrics may take a while.