Fig. 4
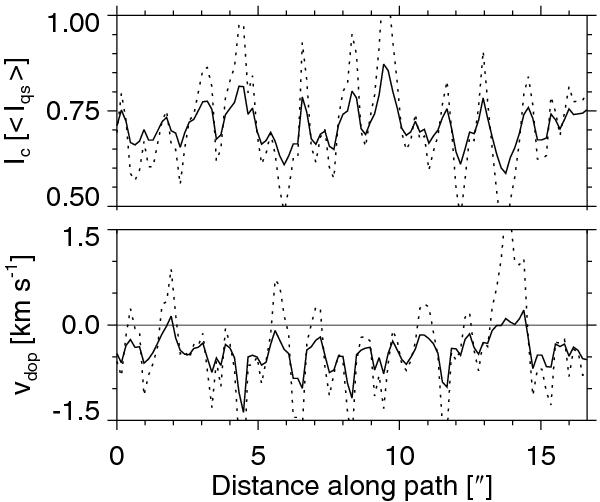
Slice through penumbra is denoted by the black curved line in Fig. 3. Upper panel: normalized intensity along the slice. The solid line corresponds to uncorrected data and the dotted line to stray-light corrected data with (α = 0.6 and σ = 2″). Lower panel: same as upper panel but for velocity. It is seen that the dotted line shows significant patches of downflows (υ > 0).
Current usage metrics show cumulative count of Article Views (full-text article views including HTML views, PDF and ePub downloads, according to the available data) and Abstracts Views on Vision4Press platform.
Data correspond to usage on the plateform after 2015. The current usage metrics is available 48-96 hours after online publication and is updated daily on week days.
Initial download of the metrics may take a while.