Fig. 3
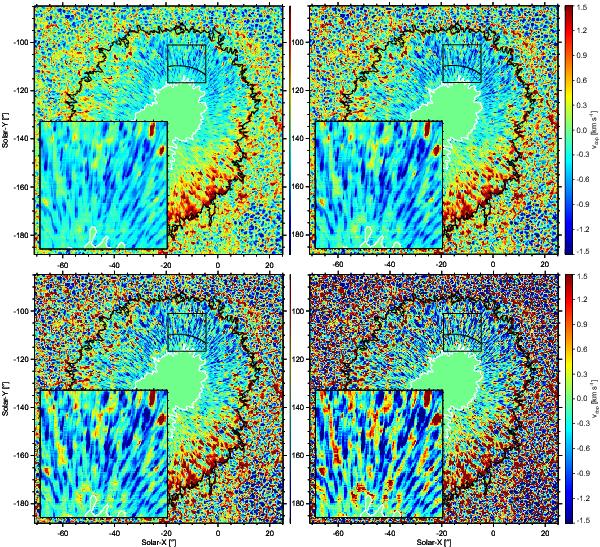
Upper left: original velocity map derived from the shifts of the line wing of Fe I 630.15 nm for AR 10923 at θ ≈ 8°. The coordinates are in arcsec relative to disc center. The large inlay is a magnification of the black box. The values along the back slice in the box are plotted in Fig. 4. The other three maps show the velocity map with varying stray-light fractions: α = 0.20 (upper right), α = 0.40 (lower left), and α = 0.60 (lower right). The width of the Gaussian is σ = 2″ in all cases.
Current usage metrics show cumulative count of Article Views (full-text article views including HTML views, PDF and ePub downloads, according to the available data) and Abstracts Views on Vision4Press platform.
Data correspond to usage on the plateform after 2015. The current usage metrics is available 48-96 hours after online publication and is updated daily on week days.
Initial download of the metrics may take a while.