Fig. 2
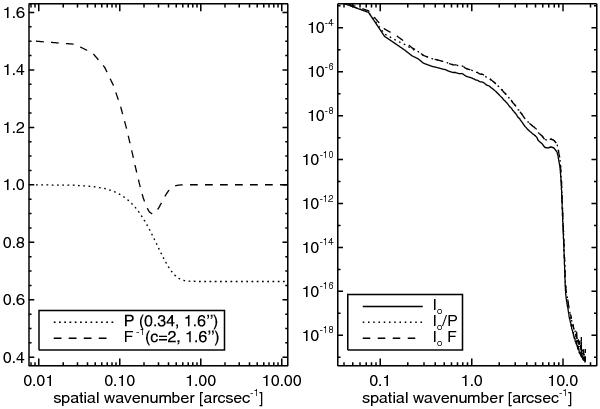
A comparison of the inverse Wiener filter F-1 used by
(Joshi et al. 2011) (dashed line) and our
deconvolution with  (dotted line), as given by Eq. (5).
The left panel displays the two functions, and the right
panel displays the power spectra of the uncorrected (solid line) and
corrected images. Differences in the power spectrum between the two methods (dashed
and dotted lines) are seen to be very small.
(dotted line), as given by Eq. (5).
The left panel displays the two functions, and the right
panel displays the power spectra of the uncorrected (solid line) and
corrected images. Differences in the power spectrum between the two methods (dashed
and dotted lines) are seen to be very small.
Current usage metrics show cumulative count of Article Views (full-text article views including HTML views, PDF and ePub downloads, according to the available data) and Abstracts Views on Vision4Press platform.
Data correspond to usage on the plateform after 2015. The current usage metrics is available 48-96 hours after online publication and is updated daily on week days.
Initial download of the metrics may take a while.