Fig. 1
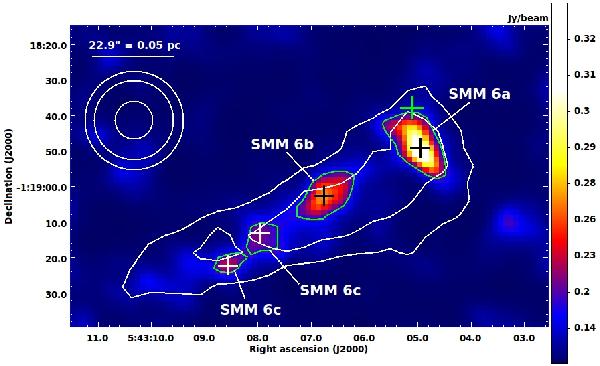
SABOCA 350-μm image of the fragmented prestellar core SMM 6 in Orion
B9. The image is displayed with power-law scaling, and the colour bar indicates the
surface-brightness scale in Jy beam-1. The overlaid green SABOCA contours
are plotted at three times the noise level (3σ = 180 mJy
beam-1). The white contours show the Herschel/SPIRE
250-μm dust continuum emission (18″ resolution); these contours are
plotted at 3.0 and 3.5 Jy beam-1. The green plus sign indicates the target
position of our previous molecular-line observations, while the other plus signs mark
the target positions of the present study (i.e., the 350-μm peaks). A
scale bar indicating the 0.05 pc projected length is shown in the top left, with the
assumption of a 450 pc line-of-sight distance. The three circles in the upper left
corner show the effective FWHM of the SABOCA beam
( ), and the smallest
(
), and the smallest
( ) and largest
(
) and largest
( ) beamsizes of the present
molecular-line observations.
) beamsizes of the present
molecular-line observations.
Current usage metrics show cumulative count of Article Views (full-text article views including HTML views, PDF and ePub downloads, according to the available data) and Abstracts Views on Vision4Press platform.
Data correspond to usage on the plateform after 2015. The current usage metrics is available 48-96 hours after online publication and is updated daily on week days.
Initial download of the metrics may take a while.