Free Access
Fig. 9
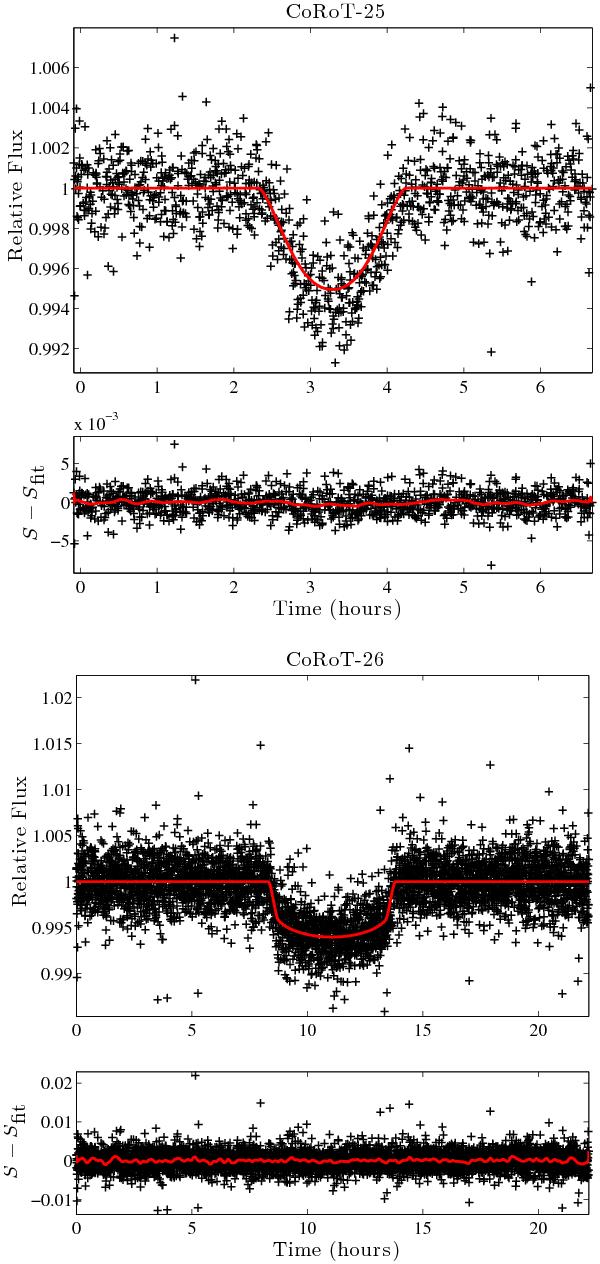
Transits of CoRoT-25 (left) and CoRoT-26 (right). Top panels: light curve folded by the orbital period (black crosses) and the transit model computed from the most probable value of the different parameters (red line). Bottom panels: residuals after subtraction of this model; the red line is a smoothing over 30 points.
This figure is made of several images, please see below:
Current usage metrics show cumulative count of Article Views (full-text article views including HTML views, PDF and ePub downloads, according to the available data) and Abstracts Views on Vision4Press platform.
Data correspond to usage on the plateform after 2015. The current usage metrics is available 48-96 hours after online publication and is updated daily on week days.
Initial download of the metrics may take a while.