Free Access
Fig. 2
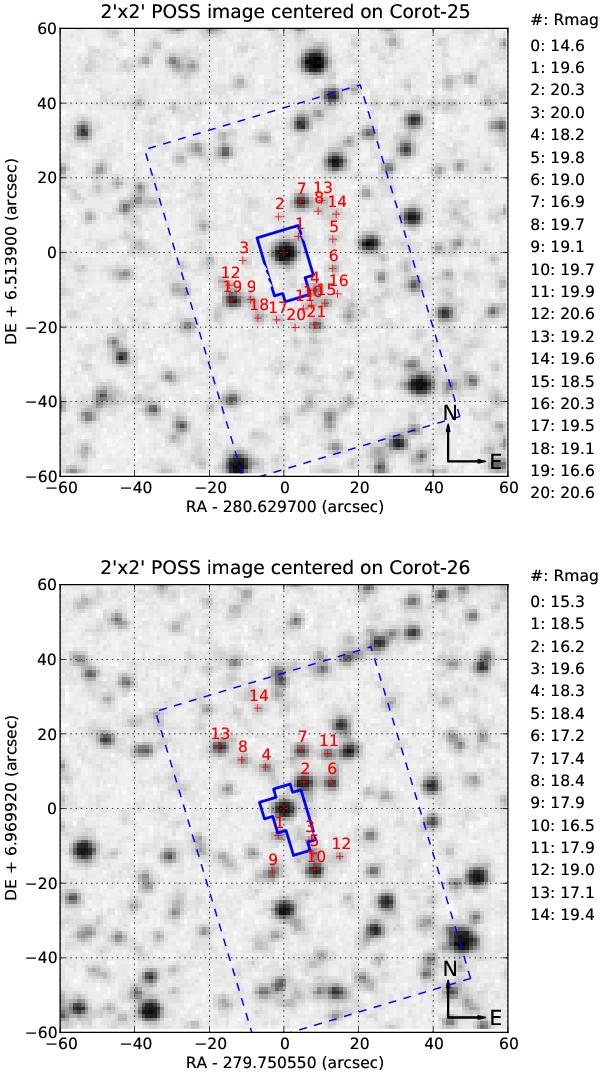
POSS image of CoRoT-25 and CoRoT-26 (marked with a red cross in the center of the field) with the CoRoT mask superimposed (in blue solid line), and the contaminating stars (red crosses identified with a number, the contaminating R-magnitude its at the right of the image).
This figure is made of several images, please see below:
Current usage metrics show cumulative count of Article Views (full-text article views including HTML views, PDF and ePub downloads, according to the available data) and Abstracts Views on Vision4Press platform.
Data correspond to usage on the plateform after 2015. The current usage metrics is available 48-96 hours after online publication and is updated daily on week days.
Initial download of the metrics may take a while.