Fig. 1
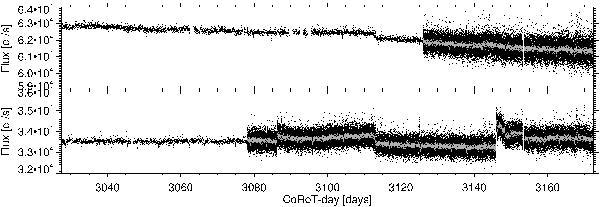
CoRoT light curve from raw data of CoRoT-25 (top) and CoRoT-26 (bottom). The changes in sampling rates from 512 to 32 s appear as increases in the scatter. In gray dots, the 32 s integrations are binned to 512 s. The light curves show discontinuities due to the impact of high-energy particles and other instrumental effects. The transits can be seen as regular dips.
Current usage metrics show cumulative count of Article Views (full-text article views including HTML views, PDF and ePub downloads, according to the available data) and Abstracts Views on Vision4Press platform.
Data correspond to usage on the plateform after 2015. The current usage metrics is available 48-96 hours after online publication and is updated daily on week days.
Initial download of the metrics may take a while.