Fig. 6
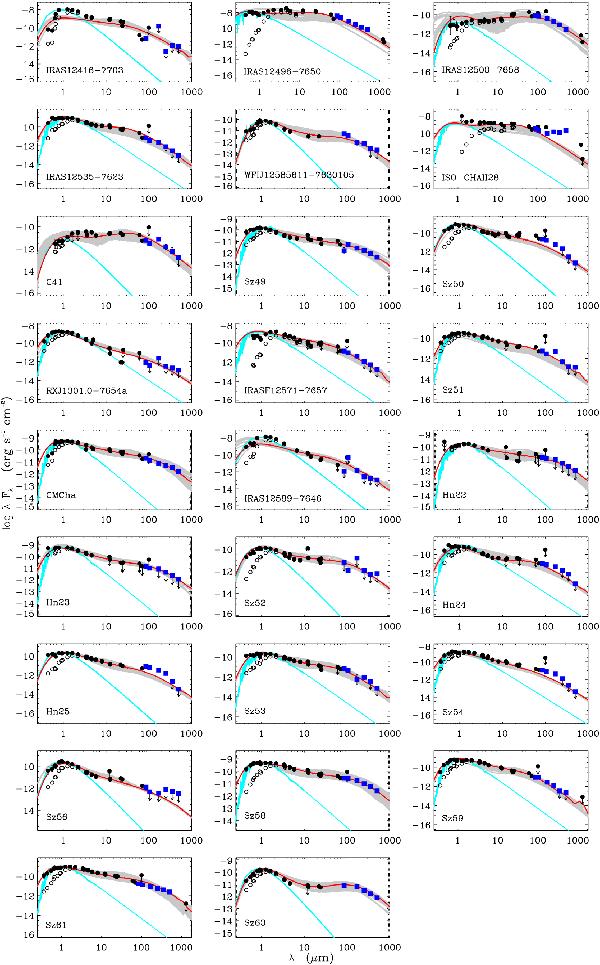
Observed (open circles) and dereddened (dots) spectral energy distributions of known YSOs in Cha II detected with the HGBS. The squares mark PACS and SPIRE fluxes, while the dots are optical-to-infrared flux measurements from previous surveys (Alcalá et al. 2008). The Kurucz’s model spectrum (for objects with Teff ≥ 3500 K) or the blackbody spectrum (for objects with Teff < 3500 K) with the same Teff as the object and scaled to its distance and radius (Spezzi et al. 2008), is overplotted on each SED, representing the stellar flux. The red thick line is the best-fitting RADMC-2D SED model, while the gray lines display the first 100 best-fitting SED models.
Current usage metrics show cumulative count of Article Views (full-text article views including HTML views, PDF and ePub downloads, according to the available data) and Abstracts Views on Vision4Press platform.
Data correspond to usage on the plateform after 2015. The current usage metrics is available 48-96 hours after online publication and is updated daily on week days.
Initial download of the metrics may take a while.