Fig. 4
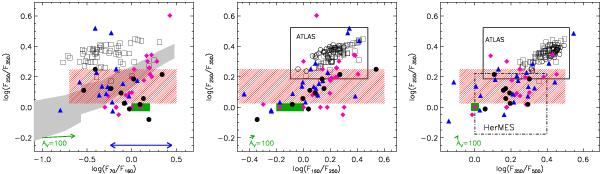
PACS/SPIRE color–color diagrams, where colors are defined as the ratio logarithm of the flux densities in Jy measured in two different bands. The black filled circles are the YSOs in Cha II, while the magenta diamonds and blue triangles are YSOs in Cha I (Winston et al. 2012) and Serpens (Bressert et al. 2013), respectively. The red-striped areas mark the YSO loci proposed in this work. The open squares and circles represent the galaxy samples of Dale et al. (2012) and Corbelli et al. (2012), respectively. The green-filled area display the predicted colors for stellar photospheric emission. The arrow indicates the AV = 100 mag reddening vector. The solid and dot-dashed lines in the middle and right panels indicate the loci of galaxies in the Herschel-ATLAS catalog and AGNs in the Herschel-HerMES survey, respectively. In the left panel, the gray-filled area is the protostar locus predicted in Ali et al. (2010), while the arrow-head line displays the log (F70/F160) color range of the very low-mass stars and brown dwarfs in Harvey et al. (2012b).
Current usage metrics show cumulative count of Article Views (full-text article views including HTML views, PDF and ePub downloads, according to the available data) and Abstracts Views on Vision4Press platform.
Data correspond to usage on the plateform after 2015. The current usage metrics is available 48-96 hours after online publication and is updated daily on week days.
Initial download of the metrics may take a while.