Fig. 3
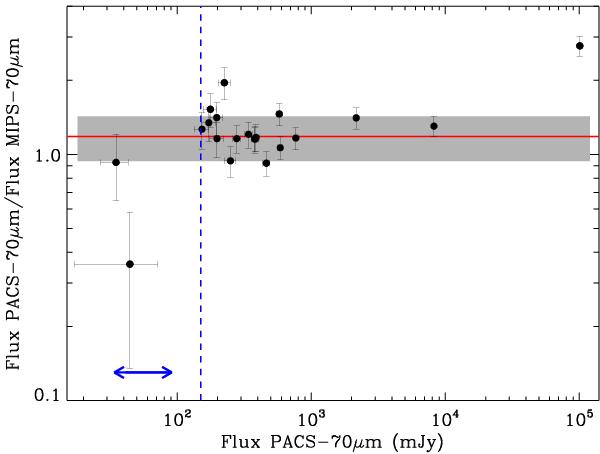
Comparison between the flux at 70 μm as measured with PACS and the flux measured with MIPS at the same wavelength for the 23 YSOs in Cha II detected with the HGBS. The solid line and shaded area indicate the median value and the rms of the flux ratio, respectively. The arrow-head line displays the MIPS-70 μm flux range of Cha II YSOs not detected with PACS. The dashed line indicates the PACS-70 μm 5σ detection limit. The clear outlier is Sz 49, the faintest YSO detected with PACS.
Current usage metrics show cumulative count of Article Views (full-text article views including HTML views, PDF and ePub downloads, according to the available data) and Abstracts Views on Vision4Press platform.
Data correspond to usage on the plateform after 2015. The current usage metrics is available 48-96 hours after online publication and is updated daily on week days.
Initial download of the metrics may take a while.