Free Access
Fig. 7
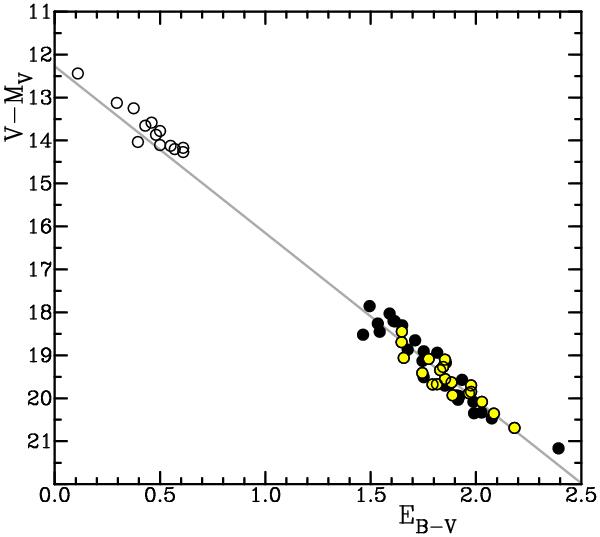
Variable-extinction diagram for members of Westerlund 2 from ZAMS fitting (filled circles) and spectroscopic distance moduli (circled yellow points), and for members of IC 2581 (open circles). The gray line represents the best-fitting parameters (see text).
Current usage metrics show cumulative count of Article Views (full-text article views including HTML views, PDF and ePub downloads, according to the available data) and Abstracts Views on Vision4Press platform.
Data correspond to usage on the plateform after 2015. The current usage metrics is available 48-96 hours after online publication and is updated daily on week days.
Initial download of the metrics may take a while.