Fig. 5
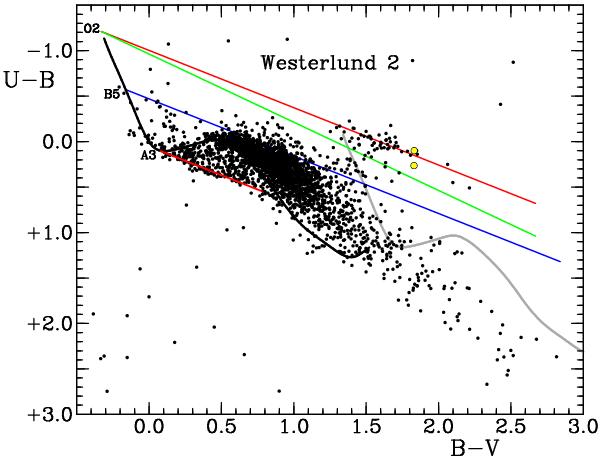
Observed colors for stars in Westerlund 2, with data for the Wolf-Rayet stars WR 20a and WR 20b plotted as circled yellow points. The intrinsic relation for dwarfs is plotted as a solid black curve, with the same relation reddened by EB − V = 1.65 as a gray curve. Reddening lines of slope EU − B/EB − V = 0.64 are plotted relative to the hottest O stars and A3 dwarfs (red lines), and B5 dwarfs (blue line). A similar reddening line of slope EU − B/EB − V = 0.75 is shown for the hottest O stars (green line).
Current usage metrics show cumulative count of Article Views (full-text article views including HTML views, PDF and ePub downloads, according to the available data) and Abstracts Views on Vision4Press platform.
Data correspond to usage on the plateform after 2015. The current usage metrics is available 48-96 hours after online publication and is updated daily on week days.
Initial download of the metrics may take a while.