Fig. 7
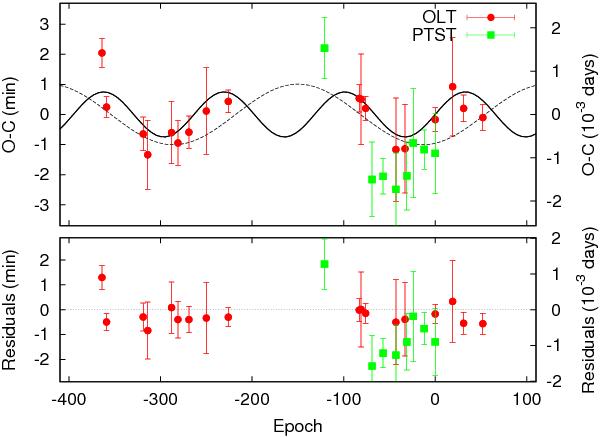
OC diagram for Qatar-1 in minutes (left axis) and days (right axis) considering the OLT (red circles) and PTST (green squares) data points, along with the timing residuals. Our initial best-fitting model is overplotted with a continuous black line, and the second one with a dashed black line.
Current usage metrics show cumulative count of Article Views (full-text article views including HTML views, PDF and ePub downloads, according to the available data) and Abstracts Views on Vision4Press platform.
Data correspond to usage on the plateform after 2015. The current usage metrics is available 48-96 hours after online publication and is updated daily on week days.
Initial download of the metrics may take a while.