Free Access
Fig. 6
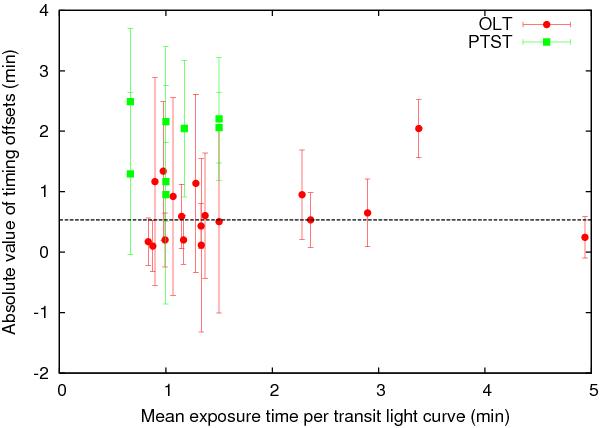
Timing-residual magnitudes in minutes for OLT (red circles) and PTST (green squares), as a function of mean exposure times. The horizontal dashed line indicates half of the mean exposure time.
Current usage metrics show cumulative count of Article Views (full-text article views including HTML views, PDF and ePub downloads, according to the available data) and Abstracts Views on Vision4Press platform.
Data correspond to usage on the plateform after 2015. The current usage metrics is available 48-96 hours after online publication and is updated daily on week days.
Initial download of the metrics may take a while.