Free Access
Fig. 4
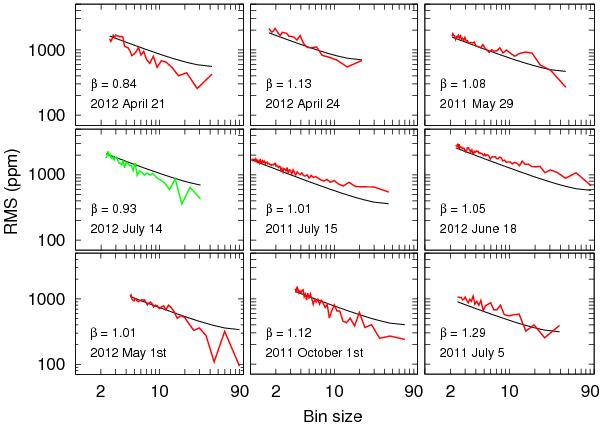
Qatar-1 rms in parts per million (ppm) of the time-binned residuals as a function of bin size in logarithmic scale. Red and green lines correspond to OLT and PTST data respectively, and black lines show the expected behavior under the presence of uncorrelated noise.
Current usage metrics show cumulative count of Article Views (full-text article views including HTML views, PDF and ePub downloads, according to the available data) and Abstracts Views on Vision4Press platform.
Data correspond to usage on the plateform after 2015. The current usage metrics is available 48-96 hours after online publication and is updated daily on week days.
Initial download of the metrics may take a while.