Free Access
Fig. 12
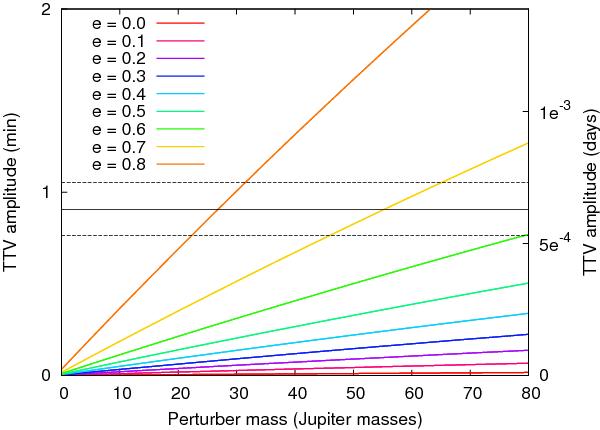
TTV amplitude as a function of the mass of the perturber for different eccentricity values. The black continuous line shows the best-fitted amplitude to our OC diagram, along with 1σ errors (dashed lines).
Current usage metrics show cumulative count of Article Views (full-text article views including HTML views, PDF and ePub downloads, according to the available data) and Abstracts Views on Vision4Press platform.
Data correspond to usage on the plateform after 2015. The current usage metrics is available 48-96 hours after online publication and is updated daily on week days.
Initial download of the metrics may take a while.