Fig. 10
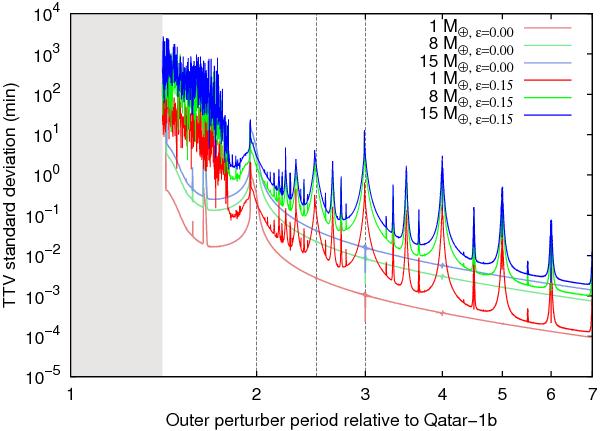
Simulated TTV standard deviation in minutes of Qatar-1b as a function of the outer perturber period, for two values of eccentricity and three values of perturber masses. The gray area on the left correspond to perturber orbits that would make the Qatar-1b orbit unstable. The mean motion resonances 2:1, 3:1, and 5:2 are indicated with vertical dashed lines.
Current usage metrics show cumulative count of Article Views (full-text article views including HTML views, PDF and ePub downloads, according to the available data) and Abstracts Views on Vision4Press platform.
Data correspond to usage on the plateform after 2015. The current usage metrics is available 48-96 hours after online publication and is updated daily on week days.
Initial download of the metrics may take a while.