Free Access
Fig. 9
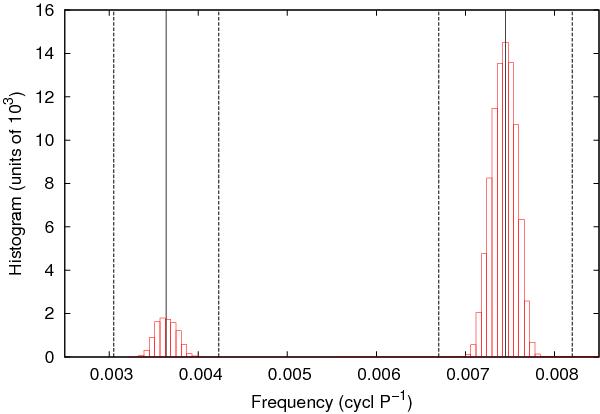
Histogram of the leading frequencies obtained after incrementing the individual mid-transit errors, in units of 103. Vertical continuous lines indicate our best two leading frequencies νTTV,1 and νTTV,2, along with 1σ errors (dashed vertical lines).
Current usage metrics show cumulative count of Article Views (full-text article views including HTML views, PDF and ePub downloads, according to the available data) and Abstracts Views on Vision4Press platform.
Data correspond to usage on the plateform after 2015. The current usage metrics is available 48-96 hours after online publication and is updated daily on week days.
Initial download of the metrics may take a while.