Fig. 8
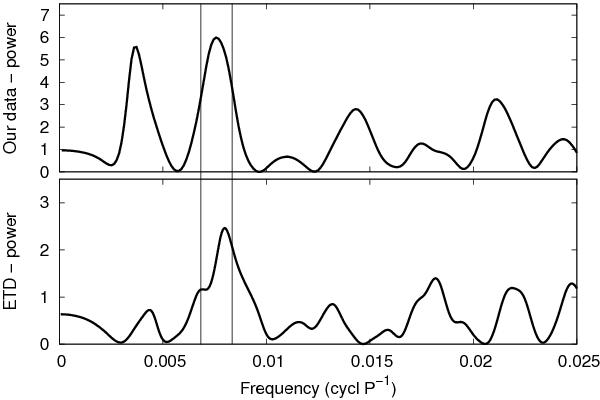
Zechmeister & Kürster (2009) periodograms generated from the timing residuals of Qatar-1, showing a peak at νTTV,1 = 0.00759 ± 0.00075 cycl P-1 (our data, top panel) and νTTV,ETD = 0.0078 ± 0.0011 cycl P-1 (ETD data, bottom panel). Vertical lines indicate the 1σ error on νTTV,1. The parameters derived from our periodogram are maximum power =6.1, and FAP for the maximum-power peak =0.19%.
Current usage metrics show cumulative count of Article Views (full-text article views including HTML views, PDF and ePub downloads, according to the available data) and Abstracts Views on Vision4Press platform.
Data correspond to usage on the plateform after 2015. The current usage metrics is available 48-96 hours after online publication and is updated daily on week days.
Initial download of the metrics may take a while.