Fig. 8
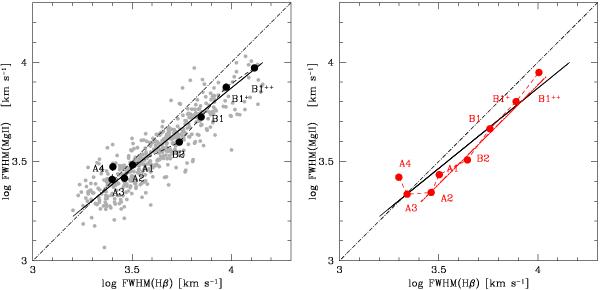
FWHM of Mgiiλ2800 vs. FWHM Hβ on log scale. Left: full profiles, right: only BC (of single component for Mgiiλ2800). Gray dots are the data points of Wang et al. (2009), with the line representing their best fit. The large black spots are the median values for the full profiles of our median spectra. The dot-dashed lines traces the equality relation, and the thin red line a fixed ratio 0.77.
Current usage metrics show cumulative count of Article Views (full-text article views including HTML views, PDF and ePub downloads, according to the available data) and Abstracts Views on Vision4Press platform.
Data correspond to usage on the plateform after 2015. The current usage metrics is available 48-96 hours after online publication and is updated daily on week days.
Initial download of the metrics may take a while.