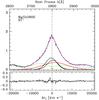
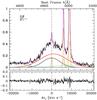
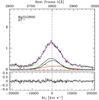
Fig. 2
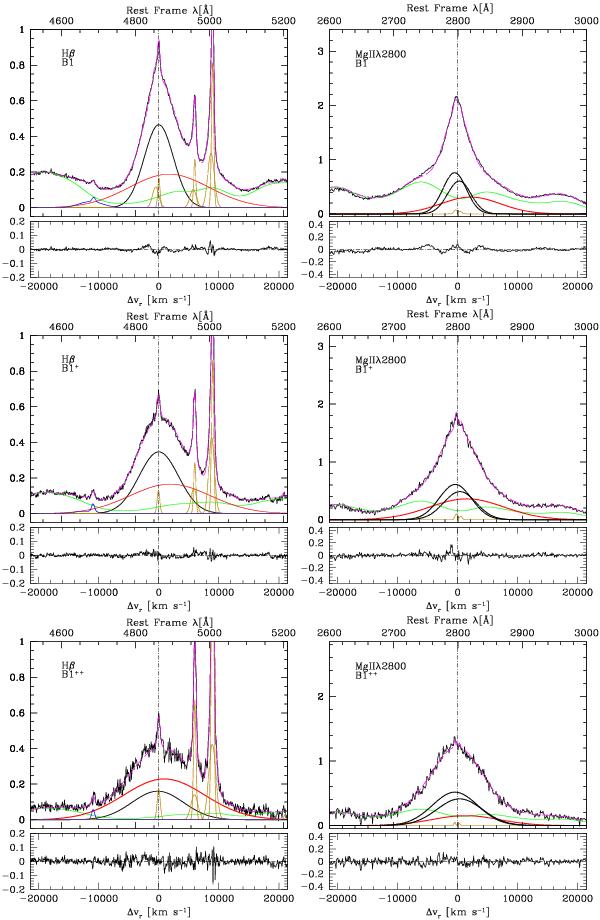
Spectra of Hβ (left panels) and of Mgiiλ2800 (right panels) for spectral types B1 to B1++ (from top to bottom). The horizontal scales are in rest frame wavelength [Å] or radial velocity, with the origin set at the rest frame wavelength. The black lines shows the original, continuum-subtracted spectrum, and the dashed magenta line the model with all emission line components. The thick black line is the BC; the thick red line shows the VBC. The green lines trace the Fe iiopt and FeiiUV contribution, and the gold lines various contributions associated to the NLR (HβNC, [Oiii]λλ4959,5007, and Mgiiλ2800 narrow component when appropriate). Excess emission at λ ≳ 2900 Å visible in this and in the next two figures is likely due to a combination of Fei and Balmer continuum emission.
Current usage metrics show cumulative count of Article Views (full-text article views including HTML views, PDF and ePub downloads, according to the available data) and Abstracts Views on Vision4Press platform.
Data correspond to usage on the plateform after 2015. The current usage metrics is available 48-96 hours after online publication and is updated daily on week days.
Initial download of the metrics may take a while.