Free Access
Fig. 2
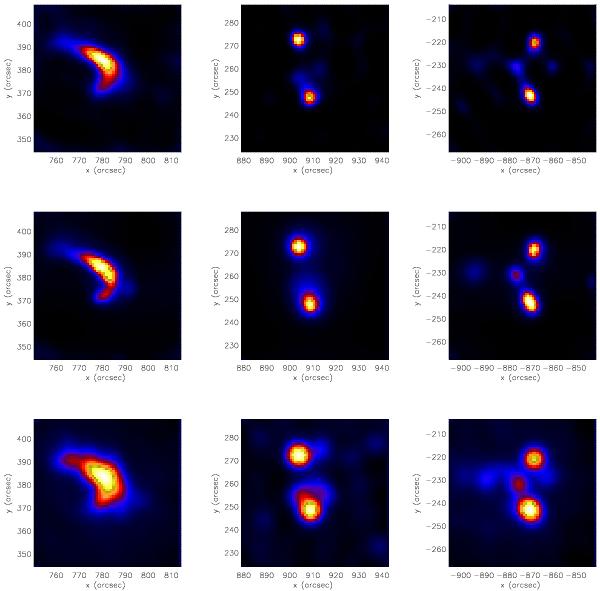
Performance of EM with real data observed by RHESSI. First row: EM reconstructions; second row: Pixon reconstructions; third row: CLEAN reconstructions. First column: 15 April 2002 event; second column: 20 February 2002 event; third column: July 23 2002 event.
Current usage metrics show cumulative count of Article Views (full-text article views including HTML views, PDF and ePub downloads, according to the available data) and Abstracts Views on Vision4Press platform.
Data correspond to usage on the plateform after 2015. The current usage metrics is available 48-96 hours after online publication and is updated daily on week days.
Initial download of the metrics may take a while.