Fig. 1
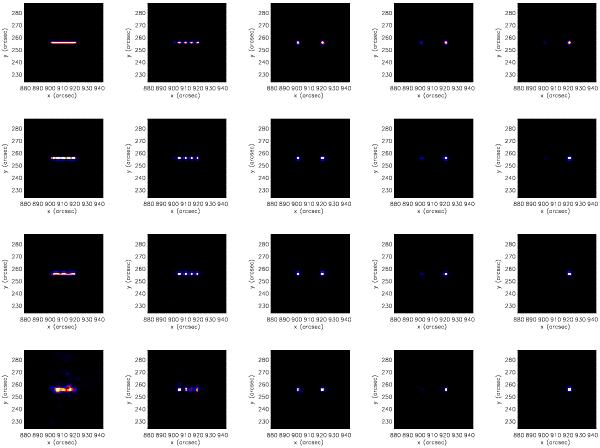
Validation of EM with synthetic data. First row: the simulated configurations. Rows 2 through 4: reconstructions provided by EM corresponding to count modulation profiles characterized by three different levels of statistics (second row: average of 100 000 counts per detector; third row: average of 10 000 counts per detector; fourth row: average of 1000 counts per detector.
Current usage metrics show cumulative count of Article Views (full-text article views including HTML views, PDF and ePub downloads, according to the available data) and Abstracts Views on Vision4Press platform.
Data correspond to usage on the plateform after 2015. The current usage metrics is available 48-96 hours after online publication and is updated daily on week days.
Initial download of the metrics may take a while.