Fig. 7
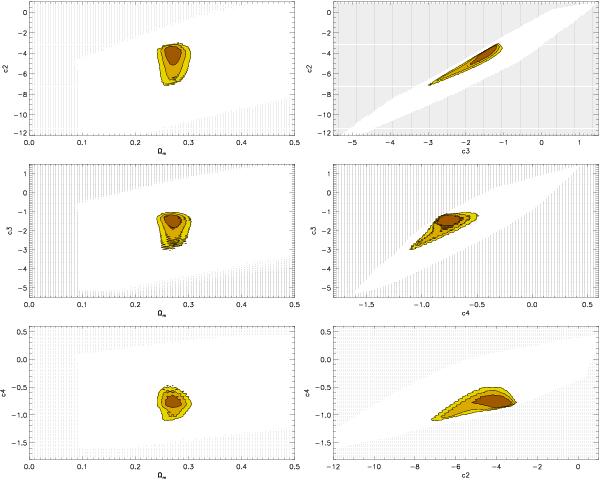
Combined constraints on the Galileon model from SNLS3, WMAP7+BAO+H0, and growth data. The filled dark, medium, and light-yellow contours enclose 68.3, 95.4, and 99.7% of the probability, respectively. Dark dotted regions correspond to scenarios rejected by theoretical constraints.
Current usage metrics show cumulative count of Article Views (full-text article views including HTML views, PDF and ePub downloads, according to the available data) and Abstracts Views on Vision4Press platform.
Data correspond to usage on the plateform after 2015. The current usage metrics is available 48-96 hours after online publication and is updated daily on week days.
Initial download of the metrics may take a while.