Fig. 4
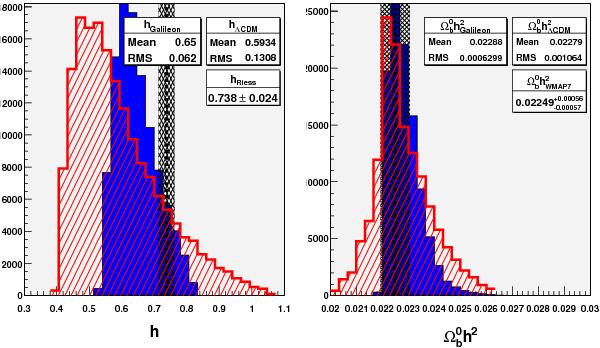
Minimized values of h and  for a large
subset of tested scenarios, in ΛCDM (red dashed histogram) and in the Galileon
cosmology (blue filled histogram). Dashed black bands represent the measurements of
H0 from Riess et al.
(2011) and from Komatsu et al. (2011). Only scenarios with
χ2 < 200 enter these
histograms to deal only with pertinent scenarios. Note that both models give values
of h and that agree
with the measurements.
for a large
subset of tested scenarios, in ΛCDM (red dashed histogram) and in the Galileon
cosmology (blue filled histogram). Dashed black bands represent the measurements of
H0 from Riess et al.
(2011) and from Komatsu et al. (2011). Only scenarios with
χ2 < 200 enter these
histograms to deal only with pertinent scenarios. Note that both models give values
of h and that agree
with the measurements.
Current usage metrics show cumulative count of Article Views (full-text article views including HTML views, PDF and ePub downloads, according to the available data) and Abstracts Views on Vision4Press platform.
Data correspond to usage on the plateform after 2015. The current usage metrics is available 48-96 hours after online publication and is updated daily on week days.
Initial download of the metrics may take a while.