Fig. 2
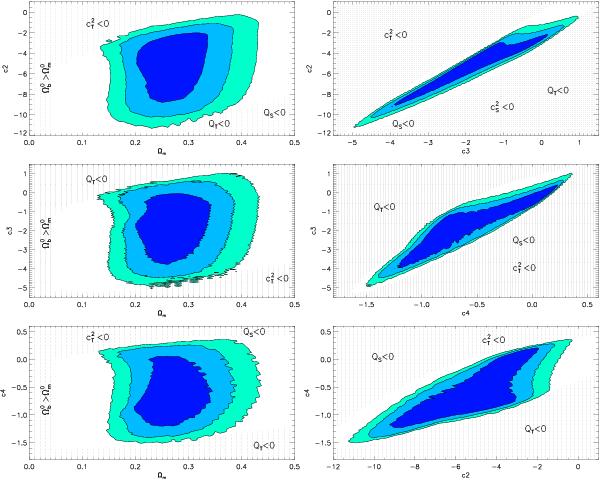
Experimental constraints on the Galileon model from SNLS3 data alone. To
represent the four-dimensional likelihood  , six two-dimensional
contours for each pair of the Galileon model parameters are presented, after
marginalizing over
, six two-dimensional
contours for each pair of the Galileon model parameters are presented, after
marginalizing over  ,
,
 ,
α, β, and the remaining Galileon parameters.
The filled dark, medium, and light-blue contours enclose 68.3, 95.4, and 99.7% of
the probability, respectively. The contours include statistical and all identified
systematic uncertainties. The dark dotted regions correspond to scenarios rejected
by theoretical constraints, as described in the text. Labels in these regions
indicate the main cause for excluding the scenarios.
,
α, β, and the remaining Galileon parameters.
The filled dark, medium, and light-blue contours enclose 68.3, 95.4, and 99.7% of
the probability, respectively. The contours include statistical and all identified
systematic uncertainties. The dark dotted regions correspond to scenarios rejected
by theoretical constraints, as described in the text. Labels in these regions
indicate the main cause for excluding the scenarios.
Current usage metrics show cumulative count of Article Views (full-text article views including HTML views, PDF and ePub downloads, according to the available data) and Abstracts Views on Vision4Press platform.
Data correspond to usage on the plateform after 2015. The current usage metrics is available 48-96 hours after online publication and is updated daily on week days.
Initial download of the metrics may take a while.