Fig. 7
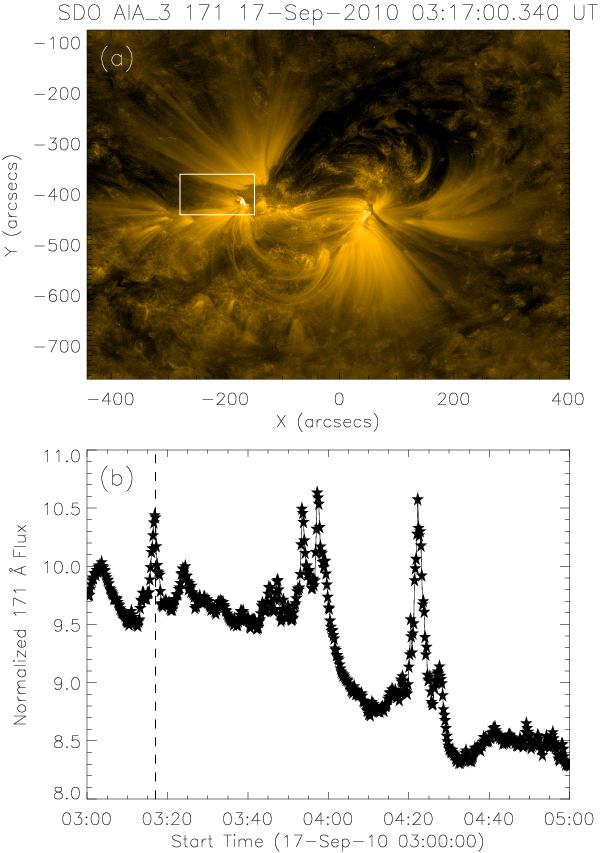
a) SDO/AIA 171 Å image. The box marks the region where the 171 Å fluxes are computed. b) SDO/AIA 171 Å flux normalized to the background level, which is defined as the flux in the quiet Sun region (see Sect. 2.1 for more details). The vertical dashed line marks the time of the 171 Å image in panel a). A movie showing the evolution of this figure from 03:00 to 05:00 UT is available online.
Current usage metrics show cumulative count of Article Views (full-text article views including HTML views, PDF and ePub downloads, according to the available data) and Abstracts Views on Vision4Press platform.
Data correspond to usage on the plateform after 2015. The current usage metrics is available 48-96 hours after online publication and is updated daily on week days.
Initial download of the metrics may take a while.