Fig. 6
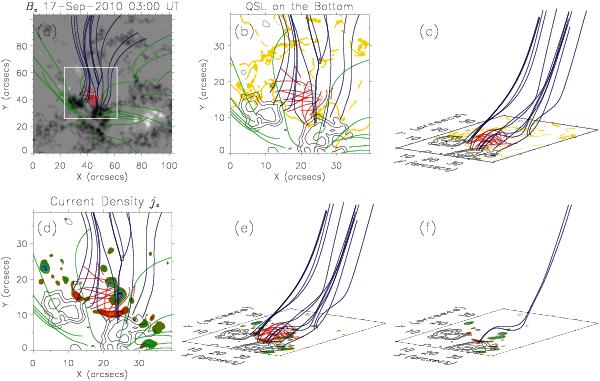
a) Magnetic field lines computed from the NLFFF model. Different colors indicate different field line systems. The background is the vertical magnetic field Bz shown with gray levels. White/black color represents positive/negative magnetic polarity. The box marks the field of view shown in panels b)–f). b), c) Orange ribbons represent the QSL sections on the photosphere. Only the QSLs with the squashing degree Q ≥ 1014 are plotted. Gray/black contours are the same as that in Fig. 4c. d), e) Magnetic field lines overlaid on the photospheric distribution of the vertical electric current density jz as shown in Fig. 4c. The current jz is computed with the non-preprocessed vector magnetic field. f) Similar to panels d) and e), but only some sample field lines with magnetic dips are shown.
Current usage metrics show cumulative count of Article Views (full-text article views including HTML views, PDF and ePub downloads, according to the available data) and Abstracts Views on Vision4Press platform.
Data correspond to usage on the plateform after 2015. The current usage metrics is available 48-96 hours after online publication and is updated daily on week days.
Initial download of the metrics may take a while.