Fig. 5
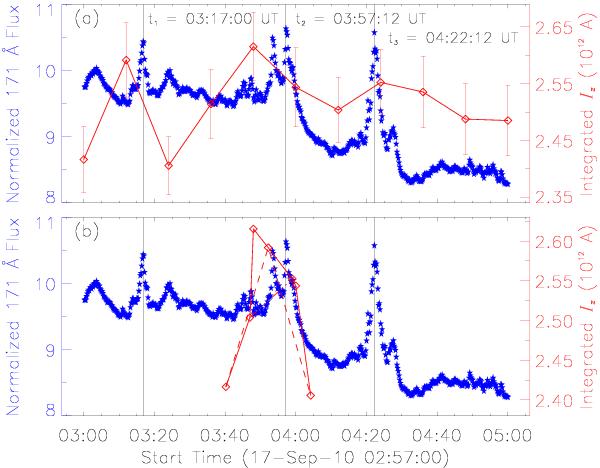
a) Evolutions of the 171 Å flux (normalized as in Fig. 2) and the unsigned vertical electric current Iz, which is integrated in the field of view as shown in Fig. 4. Blue stars mark the normalized 171 Å flux and red diamonds mark the unsigned vertical electric current Iz. b) The electric current evolution curves at the first and third peaks have been shifted to the second peak, and the total profile is shown with a continuous line. The shifted time differences are t2 − t1 and t3 − t2 for the two curves (denoted by dashed and dash-dotted lines), respectively. We note that the vertical axes for both the 171 Å flux and Iz do not start from zero.
Current usage metrics show cumulative count of Article Views (full-text article views including HTML views, PDF and ePub downloads, according to the available data) and Abstracts Views on Vision4Press platform.
Data correspond to usage on the plateform after 2015. The current usage metrics is available 48-96 hours after online publication and is updated daily on week days.
Initial download of the metrics may take a while.