Fig. 4
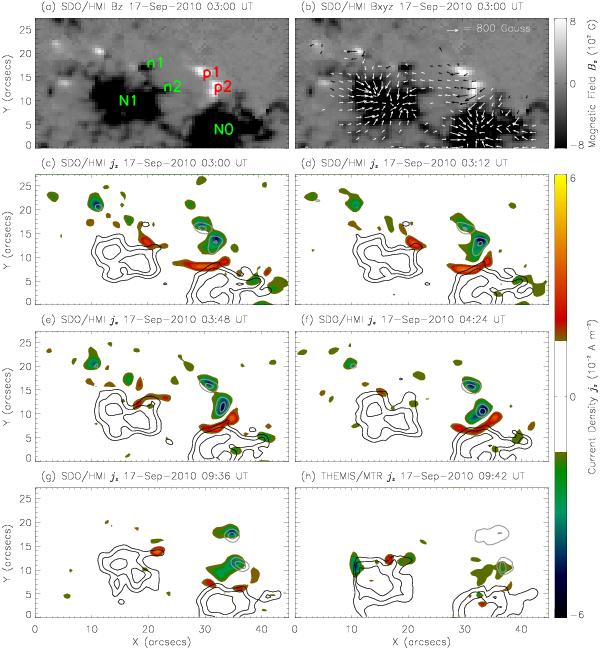
a) SDO/HMI vertical component of the magnetic field (Bz). The projection effect is removed. b) SDO/HMI vector magnetic field with the 180° ambiguity removed. c)–g) Distribution of the vertical electric current density jz averaged over 12 min at different times and observed by SDO/HMI. The middle time of the observations is indicated at the top of each panel. Gray/black lines mark the contour levels of the positive/negative polarities. The contour levels of Bz are –1200, –900, –600, 300, and 600 G. The color bar of jz is shown on the right side. h) Distribution of jz observed by THEMIS/MTR centered at 09:42 UT. The scan duration is about 16 min in this field of view. The contour levels of Bz are –882, –661, –440, 110, and 220 G, which are at the same percentage of their minimum (for the negative contours) and maximum (for the positive contours) values as that in Fig. 4g.
Current usage metrics show cumulative count of Article Views (full-text article views including HTML views, PDF and ePub downloads, according to the available data) and Abstracts Views on Vision4Press platform.
Data correspond to usage on the plateform after 2015. The current usage metrics is available 48-96 hours after online publication and is updated daily on week days.
Initial download of the metrics may take a while.