Fig. 3
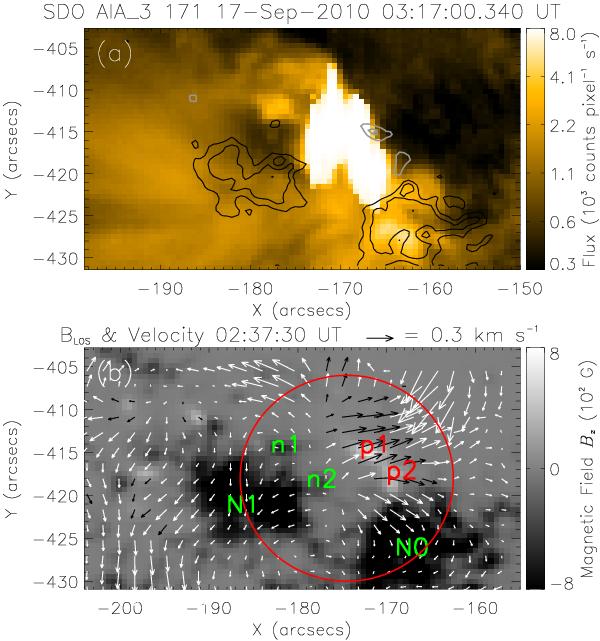
a) SDO/AIA 171 Å image overlaid by the line-of-sight magnetic field observed at the same time as that of the 171 Å image. Gray/black lines mark the contour levels of the positive/negative polarities. The contour levels of Bz are –1200, –900, –600, 300, and 600 G. b) Map of photospheric transverse velocities derived from LCT analysis with the HMI magnetograms, employing a FWHM correlation window of 5′′ during the time interval 02:25–02:50 UT. Arrows represent velocities and the background is the line-of-sight magnetogram with positive (white) and negative (black) polarities. Black/white arrows are located on positive/negative polarities. North/south is up/down, west/east is towards right/left. The magnetic polarities involved in the jets are identified with annotations (p1 and p2 for parasitic positive, n1 and n2 for parasitic negative, N0 and N1 for the main following negative polarities). The circle highlights the region of interest where the diverging flows are found. A movie showing the evolution of the line-of-sight magnetic field from 02:00 to 06:00 UT is available online.
Current usage metrics show cumulative count of Article Views (full-text article views including HTML views, PDF and ePub downloads, according to the available data) and Abstracts Views on Vision4Press platform.
Data correspond to usage on the plateform after 2015. The current usage metrics is available 48-96 hours after online publication and is updated daily on week days.
Initial download of the metrics may take a while.