Fig. 7
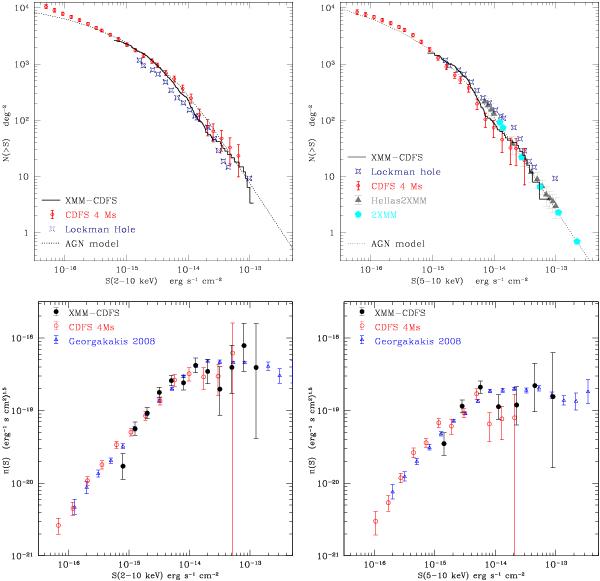
Upper panels: cumulative number counts in the 2 − 10 keV (left) and 5 − 10 keV (right) bands. Lower panels: differential number counts (left: 2 − 10; right: 5 − 10 keV band) in Euclidean scale (i.e., S2.5dN/dS). For comparison, in all panels we plot the Chandra number counts (Lehmer et al. 2012, red circles). In the upper panels, we also show the cumulative number counts from the XMM-Newton survey in the Lockman Hole (Brunner et al. 2008, blue stars), and the model cumulative counts for AGN (Gilli et al. 2007, black dotted line). In the upper right panel, we also plot the number counts from the Hellas2XMM (Baldi et al. 2002) and 2XMM (Mateos et al. 2008). In the lower panels, we also show the differential number counts from Georgakakis et al. (2008).
Current usage metrics show cumulative count of Article Views (full-text article views including HTML views, PDF and ePub downloads, according to the available data) and Abstracts Views on Vision4Press platform.
Data correspond to usage on the plateform after 2015. The current usage metrics is available 48-96 hours after online publication and is updated daily on week days.
Initial download of the metrics may take a while.