Free Access
Fig. 14
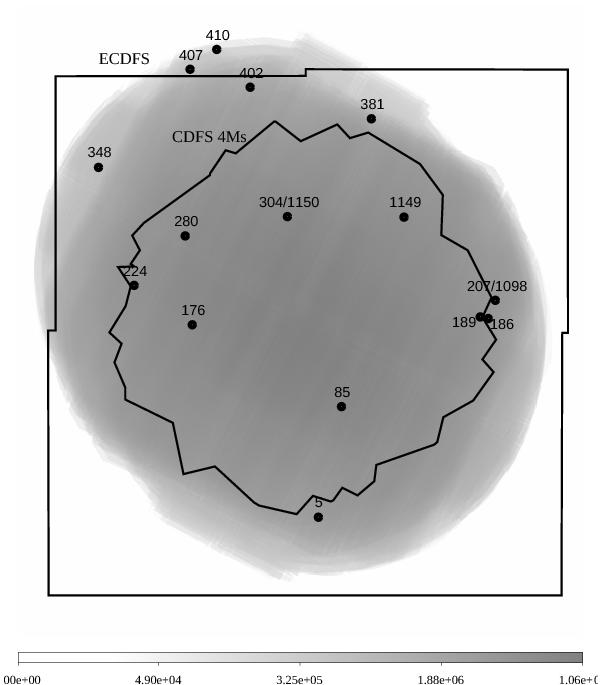
Positions and ID210/ID510 numbers of the 15 candidate real sources not previously detected by Chandra, superimposed on the XMM-Newton 2 − 10 keV exposure map. The exposure map is drawn in logarithmic scale to show also the field border where the exposure is very low. The areas previously surveyed by Chandra are also shown.
Current usage metrics show cumulative count of Article Views (full-text article views including HTML views, PDF and ePub downloads, according to the available data) and Abstracts Views on Vision4Press platform.
Data correspond to usage on the plateform after 2015. The current usage metrics is available 48-96 hours after online publication and is updated daily on week days.
Initial download of the metrics may take a while.