Fig. 9
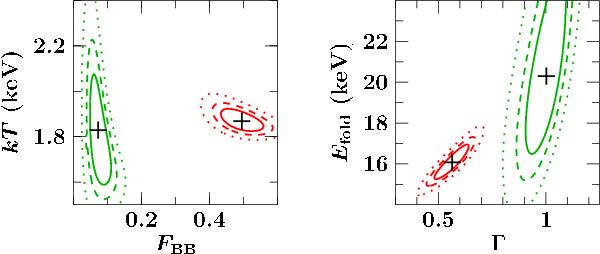
Contour maps between several continuum parameters during the 2007 outburst. Each map is calculated from RXTE data near maximum luminosity (red; obs. 93032-03-02-00) and at the end of the outburst (green; obs. 93032-03-03-04). The solid line represents the 1σ contour, the dashed line 2σ and the dotted line 3σ. The black-body flux, FBB, is given in units of 10-9 erg s-1 cm-2.
Current usage metrics show cumulative count of Article Views (full-text article views including HTML views, PDF and ePub downloads, according to the available data) and Abstracts Views on Vision4Press platform.
Data correspond to usage on the plateform after 2015. The current usage metrics is available 48-96 hours after online publication and is updated daily on week days.
Initial download of the metrics may take a while.