Fig. 6
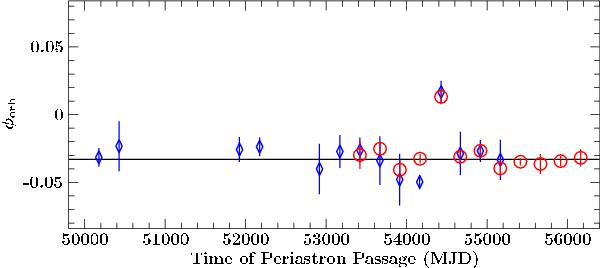
Orbital phases of each detected outburst of GRO J1008−57 in ASM (blue) and BAT (red), determined from the orbital parameters found by the arrival time analysis (see text). The solid line shows the best-fit outburst phase of the ASM- and BAT-data. The outlier is the 2007 December outburst.
Current usage metrics show cumulative count of Article Views (full-text article views including HTML views, PDF and ePub downloads, according to the available data) and Abstracts Views on Vision4Press platform.
Data correspond to usage on the plateform after 2015. The current usage metrics is available 48-96 hours after online publication and is updated daily on week days.
Initial download of the metrics may take a while.