Fig. 5
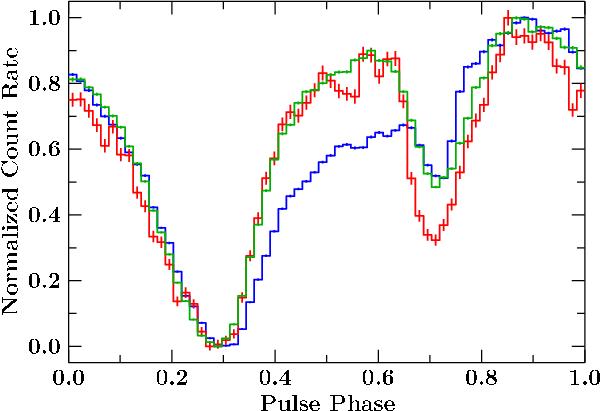
RXTE-PCA (blue), Swift-XRT (red), and Suzaku-XIS3 pulse profiles (green). The profiles are folded on the first time bin of the extracted XIS3 light curve (MJD 54 434.4819). Owing to a comparable sensitive energy range the profiles as detected by Swift-XRT (0.2–10 keV) and Suzaku-XIS3 (0.2–12 keV) are similar in shape, while the secondary peak is much more prominent at higher energies as seen in RXTE-PCA (2–60 keV). To show the good agreement between the Swift and Suzaku data, profiles are shown with 64 bins instead of the 32 bins used for the arrival time analysis.
Current usage metrics show cumulative count of Article Views (full-text article views including HTML views, PDF and ePub downloads, according to the available data) and Abstracts Views on Vision4Press platform.
Data correspond to usage on the plateform after 2015. The current usage metrics is available 48-96 hours after online publication and is updated daily on week days.
Initial download of the metrics may take a while.