Fig. 14
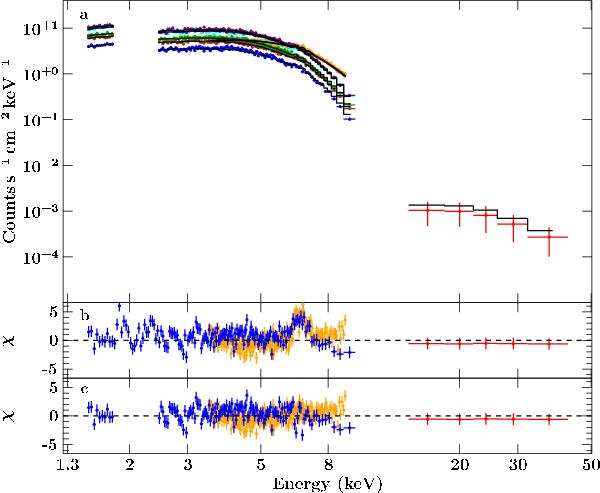
a) Five Swift-XRT (blue), Swift-BAT (red) and Suzaku-XIS spectra of the type II 2012 November outburst of GRO J1008−57. Spectral channels are rebinned for display purposes. b) Combined residuals after applying the same model to the data as used in the previous analysis, including the secondary black body (see text). c) Best-fit combined residuals after excluding calibration features between 1.7 and 2.4 keV and adding three narrow Fe lines at 6.4, 6.67 keV, and 7 keV (compare Fig. 15).
Current usage metrics show cumulative count of Article Views (full-text article views including HTML views, PDF and ePub downloads, according to the available data) and Abstracts Views on Vision4Press platform.
Data correspond to usage on the plateform after 2015. The current usage metrics is available 48-96 hours after online publication and is updated daily on week days.
Initial download of the metrics may take a while.