Fig. 1
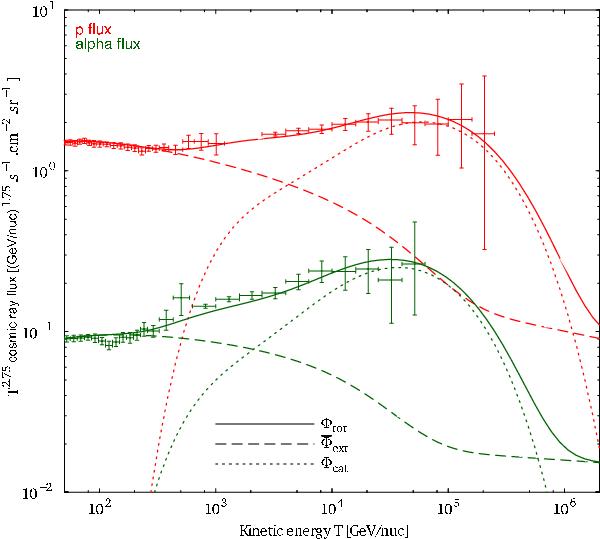
Proton (upper curve) and helium (lower curve) spectra in the range extending from 50 GeV/nuc to 100 TeV/nuc, for the propagation parameters of model A (see Table 2), giving the best fit to the PAMELA (Adriani et al. 2011) and CREAM (Ahn et al. 2010) data: supernovae explosion rate ν = 0.8century-1. Solid lines show the total flux, short-dashed lines show the flux due to the sources of the catalog, and the long-dashed curve the flux due to the rest of the sources.
Current usage metrics show cumulative count of Article Views (full-text article views including HTML views, PDF and ePub downloads, according to the available data) and Abstracts Views on Vision4Press platform.
Data correspond to usage on the plateform after 2015. The current usage metrics is available 48-96 hours after online publication and is updated daily on week days.
Initial download of the metrics may take a while.