Free Access
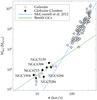
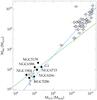
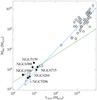
Fig. 2
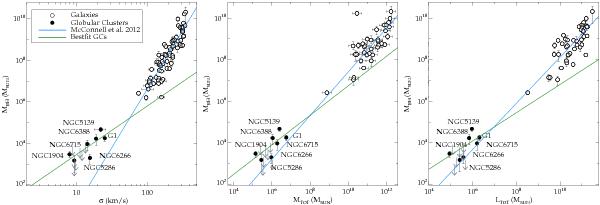
M• − σ, M• − Mtot, and M• − Ltot relations of IMBHs and SMBHs in comparison. The slope of the best fit to the GCs (green line) is a factor of two shallower than the slope for the SMBHs in galaxies (blue line) for M• − σ, but very similar for the remaining two correlations.
This figure is made of several images, please see below:
Current usage metrics show cumulative count of Article Views (full-text article views including HTML views, PDF and ePub downloads, according to the available data) and Abstracts Views on Vision4Press platform.
Data correspond to usage on the plateform after 2015. The current usage metrics is available 48-96 hours after online publication and is updated daily on week days.
Initial download of the metrics may take a while.