Fig. 12
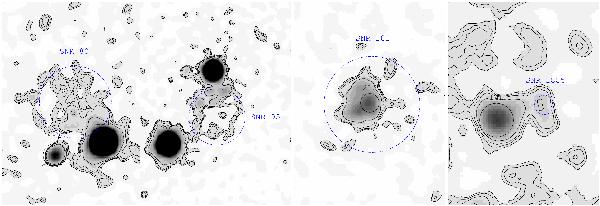
Contour plots of the logarithmically scaled merged HRC-I images with dashed circular regions at the radio positions with approximate radio radii (Fesen et al. 1999; Sjouwerman & Dickel 2001) of the known supernova remnants within 90′′ of the center of M 31. The images are smoothed with a Gaussian function of 7-pixel FWHM and contour levels are at 0.53, 0.56, 0.6, and 0.7 counts per pixel. North is up and east to the left. The zoom is slightly different (for region size and SNR names see Table 9). The X-ray catalogue source regions are circles with ~90% encircled count fraction radius.
Current usage metrics show cumulative count of Article Views (full-text article views including HTML views, PDF and ePub downloads, according to the available data) and Abstracts Views on Vision4Press platform.
Data correspond to usage on the plateform after 2015. The current usage metrics is available 48-96 hours after online publication and is updated daily on week days.
Initial download of the metrics may take a while.