Free Access
Fig. 8
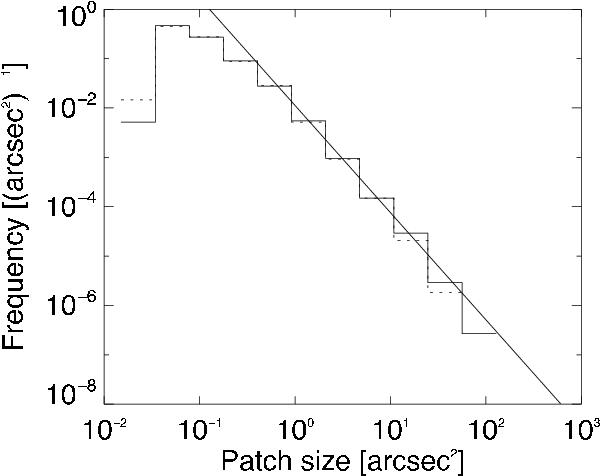
Two distributions of circular polarisation patch sizes. The solid line refers to a distribution from 2007, whereas the dotted line corresponds to 2010. The regression is a power law fit to the 2007 distribution with spectral index α = − 2.20 ± 0.05.
Current usage metrics show cumulative count of Article Views (full-text article views including HTML views, PDF and ePub downloads, according to the available data) and Abstracts Views on Vision4Press platform.
Data correspond to usage on the plateform after 2015. The current usage metrics is available 48-96 hours after online publication and is updated daily on week days.
Initial download of the metrics may take a while.