Fig. 1
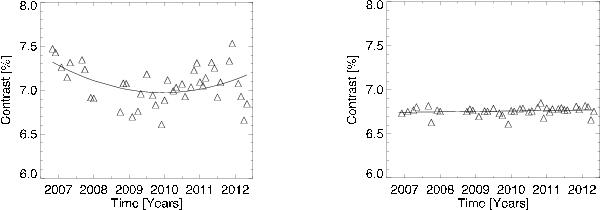
Left: original Stokes I continuum contrast variation of the employed SOT/SP images. The solid line is a quadratic fit with quadratic and linear coefficients of 0.00025 ± 0.00009 and − 0.019 ± 0.006. Right: Stokes I continuum contrast variation after each image was convolved using an artificial defocus. The solid line is a constant drawn at 6.75%.
Current usage metrics show cumulative count of Article Views (full-text article views including HTML views, PDF and ePub downloads, according to the available data) and Abstracts Views on Vision4Press platform.
Data correspond to usage on the plateform after 2015. The current usage metrics is available 48-96 hours after online publication and is updated daily on week days.
Initial download of the metrics may take a while.