Fig. 2
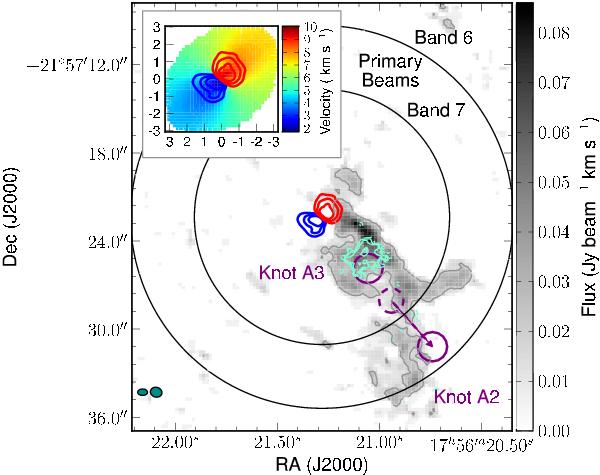
Blue shifted disk wind from HD 163296. The greyscale and single (4σ) contour show the CO J = 2–1 integrated intensity of the blue shifted wind from HD 163296. The blue and red contours show the 15, 20 and 25 times the rms noise (20 mJy beam-1) of the blue (−2 to 5.5 km s-1) and red (6 to 12 km s-1) HCO+J = 4–3 emission in the disk. The inset image shows the first moment map of the HCO+J = 4–3 emission in the disk, with the same red and blue contours as in the main figure for reference. The two black arcs show the primary beams of the 345 GHz (smaller) and 230 GHz (larger) observations. The cyan contours show 4, 6, and 8 times the rms noise in the CO J = 3–2 emission (2.6 mJy beam-1). The two solid purple circles show the 2012 positions of knots A2 and A3 as described in the text. The dashed purple circle and arrow show the position of knot A2 in 2004, and its projected motion to 2012. The two dark cyan circles in the bottom left corner show the synthesized beams of the Band 7 (left) and Band 6 (right) datasets. The dimensions of the synthesized beams are given in Table 1.
Current usage metrics show cumulative count of Article Views (full-text article views including HTML views, PDF and ePub downloads, according to the available data) and Abstracts Views on Vision4Press platform.
Data correspond to usage on the plateform after 2015. The current usage metrics is available 48-96 hours after online publication and is updated daily on week days.
Initial download of the metrics may take a while.