Fig. 4
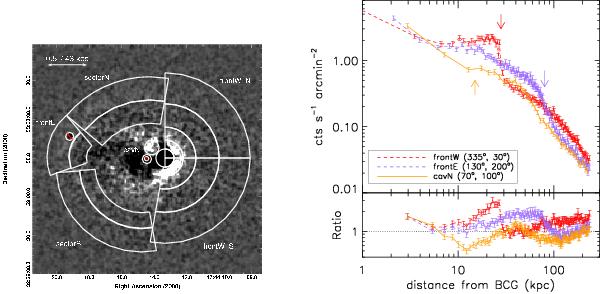
(Left) Regions of interest for the spectral analysis (see Table 1) overplotted to the unsharp mask: moving outwards, sectorN and sectorS are divided into two regions (in and out); frontE is divided into two regions across the front; frontW-in indicates the circular region in front of the edge; frontW-inN and frontW-outN, ..., out4N are the regions across the front pointing to the north-west; frontW-inS and frontW-outS, ..., out4S are the regions pointing to south-west. (Right) Surface brightness profiles extracted from the exposure-corrected 0.5–2 keV image fixing the centre on the BCG. The angles that define the sectors are measured anti-clockwise from the positive X-axis (angle = 0°). The arrows indicate the positions of the two fronts where there is a sharp steepening of the gradient. At the bottom, the ratios between the surface brightness profiles extracted in sectors and the profile obtained from the remaining X-ray emission assumed to be more undisturbed are plotted.
Current usage metrics show cumulative count of Article Views (full-text article views including HTML views, PDF and ePub downloads, according to the available data) and Abstracts Views on Vision4Press platform.
Data correspond to usage on the plateform after 2015. The current usage metrics is available 48-96 hours after online publication and is updated daily on week days.
Initial download of the metrics may take a while.