Fig. 9
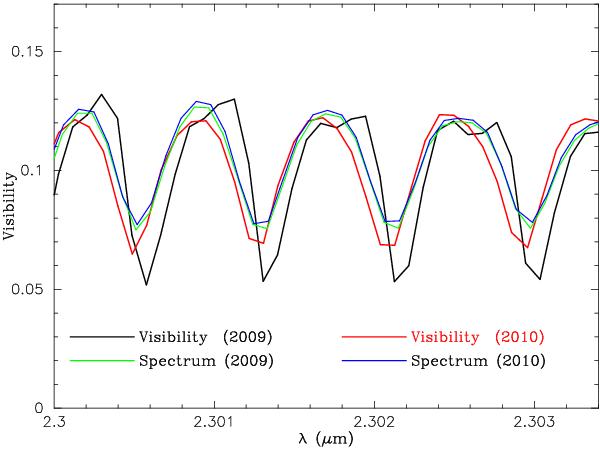
Comparison of the visibilities observed in 2009 (data set #26, black solid line) and 2010 (data set #107, red solid line). Both visibilities were taken at almost the same projected baseline length (13.9 m) and position angle (84°–85°). The spatially unresolved spectra observed in 2009 and 2010 are also plotted by the green and blue solid lines.
Current usage metrics show cumulative count of Article Views (full-text article views including HTML views, PDF and ePub downloads, according to the available data) and Abstracts Views on Vision4Press platform.
Data correspond to usage on the plateform after 2015. The current usage metrics is available 48-96 hours after online publication and is updated daily on week days.
Initial download of the metrics may take a while.