Fig. 6
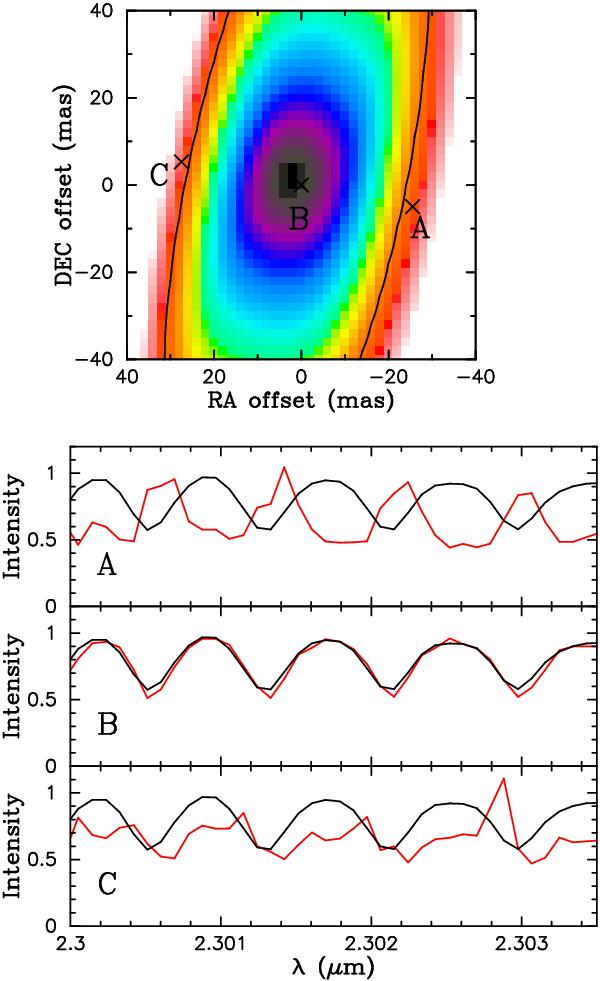
Spatially resolved spectra obtained in 2009 at three representative positions over the stellar image are plotted by the red solid lines. The representative positions are marked in the top panel, which shows the line center image at 2.30580 μm (same as Fig. 5g). The black lines represent the spatially unresolved spectrum. The spatially resolved spectra are scaled for comparison with the spatially unresolved spectrum. The black solid line in the top panel marks the limb of the star.
Current usage metrics show cumulative count of Article Views (full-text article views including HTML views, PDF and ePub downloads, according to the available data) and Abstracts Views on Vision4Press platform.
Data correspond to usage on the plateform after 2015. The current usage metrics is available 48-96 hours after online publication and is updated daily on week days.
Initial download of the metrics may take a while.