Fig. 5
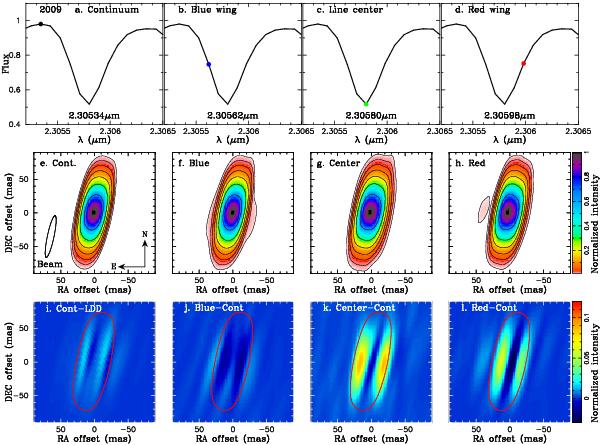
Reconstructed images of Antares in 2009 within one of the CO first overtone lines (2.3058 μm). Panels a)–d): the observed line profile with four representative wavelengths marked. Panels e)–h) show the images reconstructed at these wavelengths. The contours correspond to 1, 2, 4, 8, 16, 32, and 64% of the peak intensity of each image. Panel i) shows the difference between the reconstructed continuum image and the best-fit limb-darkened disk for the continuum visibilities, whose parameters are given in Sect. 3.1. Panels j)–l) show the continuum-subtracted images, in which the continuum image (panel e) is subtracted from the images in the panels f)–h). The limb of the star as defined in Sect. 3.3 is marked by the red solid lines.
Current usage metrics show cumulative count of Article Views (full-text article views including HTML views, PDF and ePub downloads, according to the available data) and Abstracts Views on Vision4Press platform.
Data correspond to usage on the plateform after 2015. The current usage metrics is available 48-96 hours after online publication and is updated daily on week days.
Initial download of the metrics may take a while.