Fig. 10
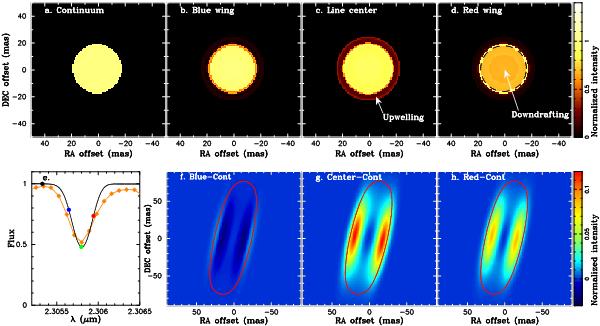
Best-fit stellar patch model with an inhomogeneous velocity field for Antares observed in 2009. Panels a)–d) show model images in the continuum, blue wing, line center, and red wing within the same CO line profile as shown in Fig. 5. The wavelengths of these images are marked with black, blue, green, and red dots in panel e), where the observed and model spectra are plotted by the filled diamonds and the black solid line, respectively. Panels f)–h) show the best-fit continuum-subtracted model images convolved with the same beam as the observed images. Therefore, these model images can be compared to the images shown in Figs. 5j–5l.
Current usage metrics show cumulative count of Article Views (full-text article views including HTML views, PDF and ePub downloads, according to the available data) and Abstracts Views on Vision4Press platform.
Data correspond to usage on the plateform after 2015. The current usage metrics is available 48-96 hours after online publication and is updated daily on week days.
Initial download of the metrics may take a while.