Fig. 3
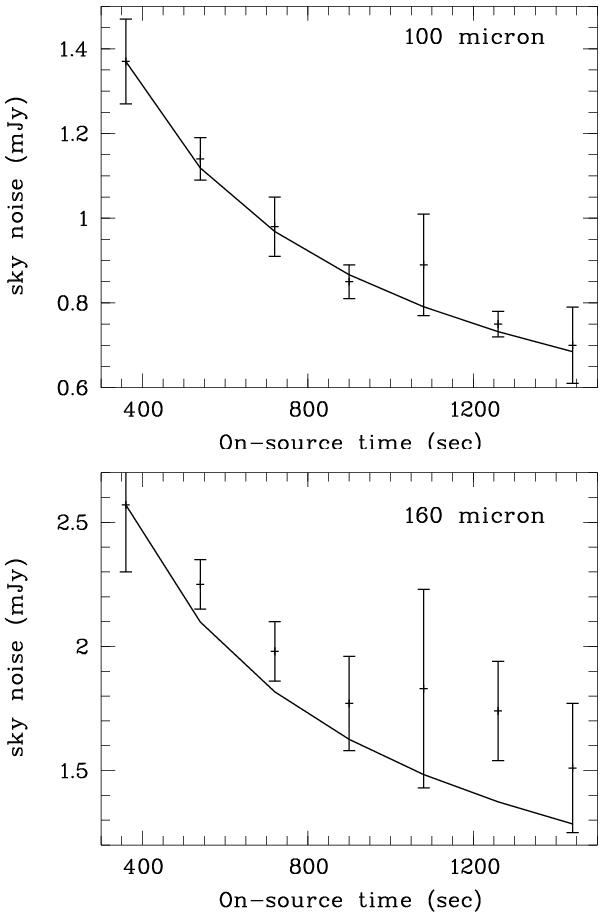
Top: mean value of the sky noise estimates at 100 μm versus on-source integration time. Error bars are the rms standard deviation of the sky noise in the images taken with the same on-source observing time. The solid curve represents the noise behaviour assuming that the S/N ratio varies as the square root of the time, normalized by the mean value of the images with an on-source exposure time of 360 s. Bottom: the same for the 160 μm images.
Current usage metrics show cumulative count of Article Views (full-text article views including HTML views, PDF and ePub downloads, according to the available data) and Abstracts Views on Vision4Press platform.
Data correspond to usage on the plateform after 2015. The current usage metrics is available 48-96 hours after online publication and is updated daily on week days.
Initial download of the metrics may take a while.